Instrumax CAD-piperidine-Test report




 Instrumax (Tianjin) Co., Ltd.Instrumax (Tianjin) Co., Ltd.
Instruments:Agilent1200 liquid chromatograph+Charged Aerosol Detector (CAD)(INSTRUMAX, Model: CADetector a1)
Reagents: pure water (Watson's distilled water), acetonitrile (chromatography grade), trifluoroacetic acid (analytical grade)
Samples: standards and samples (provided by user teachers)
Column: phenomenex Kinetex® XB-C18 5μm 4.6*250mm
Column temperature:35℃ Flow rate:1.0mL/min
Injection volume:10μL
Mobile phase A:0.1%TFA Aqueous solution mobile phase B:0.1%TFA Acetonitrile solution
Gradient conditions:
Time (minutes) | A (%) | B (%) |
0.0 | 97 | 3 |
5.0 | 97 | 3 |
10.0 | 5 | 95 |
13.0 | 5 | 95 |
13.1 | 97 | 3 |
20.0 | 97 | 3 |
CAD Conditions:
Instrument model:INSTRUMAX CADetector a1
Drift tube temperature:50℃ Atomized air flow:3L/min
Corona current:1μA Corona airflow:1L/min
Gain:0.2 RF:2.0
Instrumax (Tianjin) Co., Ltd.blank solvent 1 branch (blank),STD Sample:15µg/mL Standard sample 1 branch, sample 1 Branch (Sample)
Correspond STD sample 10%,20%,30%,50%,80%,120%,150%and 200%Concentration level samples, i.e.1.5µg/mL,3.0µg/mL,4.5µg/mL,7.5µg/mL,12.0µg/mL,18.0µg/mL,22.5µg/mL,30.0µg/mL standard sample, each 1 Branch
The blank solvent does not interfere with the determination of the target peak and has good specificity.
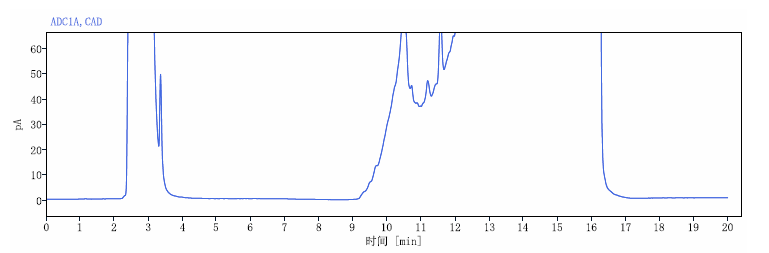
picture 1 Blank solvent (thinner)
10%Concentration level samples (Sensitivity samples), using Agilent CDS,P2P The method calculates the signal-to-noise ratio, and the signal-to-noise ratio is 43.51, meeting the detection sensitivity requirements, indicating that Charged Aerosol Detector (CAD) Responds well to low concentration samples.
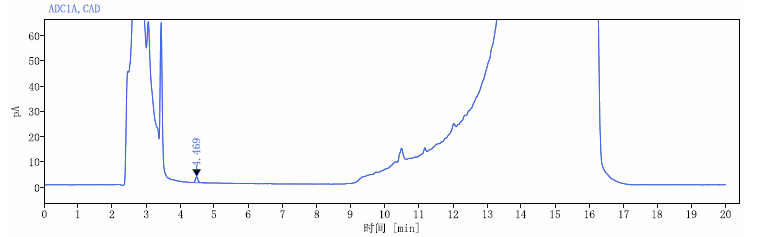

picture 2 10%Concentration level standards - signal-to-noise ratio plot
Instrumax (Tianjin) Co., Ltd.9 Each concentration level standard sample was injected separately.1 needle(concentration linear);STD Inject the standard sample into different injection volumes (injection volume is linear), and use concentration and peak area to make a linear equation. The results show that the concentration linear correlation coefficient R² is 0.9980, the linear correlation coefficient R² of the injection volume is 0.9995, indicating that the method is linear.
Concentration (µg/mL) | area | Injection volume (µL) | area | |
1.5 | 11.840 | 2.0 | 20.498 | |
3.0 | 23.015 | 5.0 | 48.113 | |
4.5 | 34.064 | 10.0 | 100.077 | |
7.5 | 54.193 | 15.0 | 152.548 | |
12.0 | 83.030 | 20.0 | 199.466 | |
15.0 | 97.061 | |||
18.0 | 125.223 | |||
22.5 | 152.703 | |||
30.0 | 195.646 | |||
Instrumax (Tianjin) Co., Ltd.STD Continuous injection of standards 6 Needle, calculate retention time, peak area and peak height RSD%.
The results show: retention time RSD% is 0.184%, peak area and peak height RSD% are respectively 1.38%and 1.65%, all less than 2.0%, indicating that the method has good repeatability.
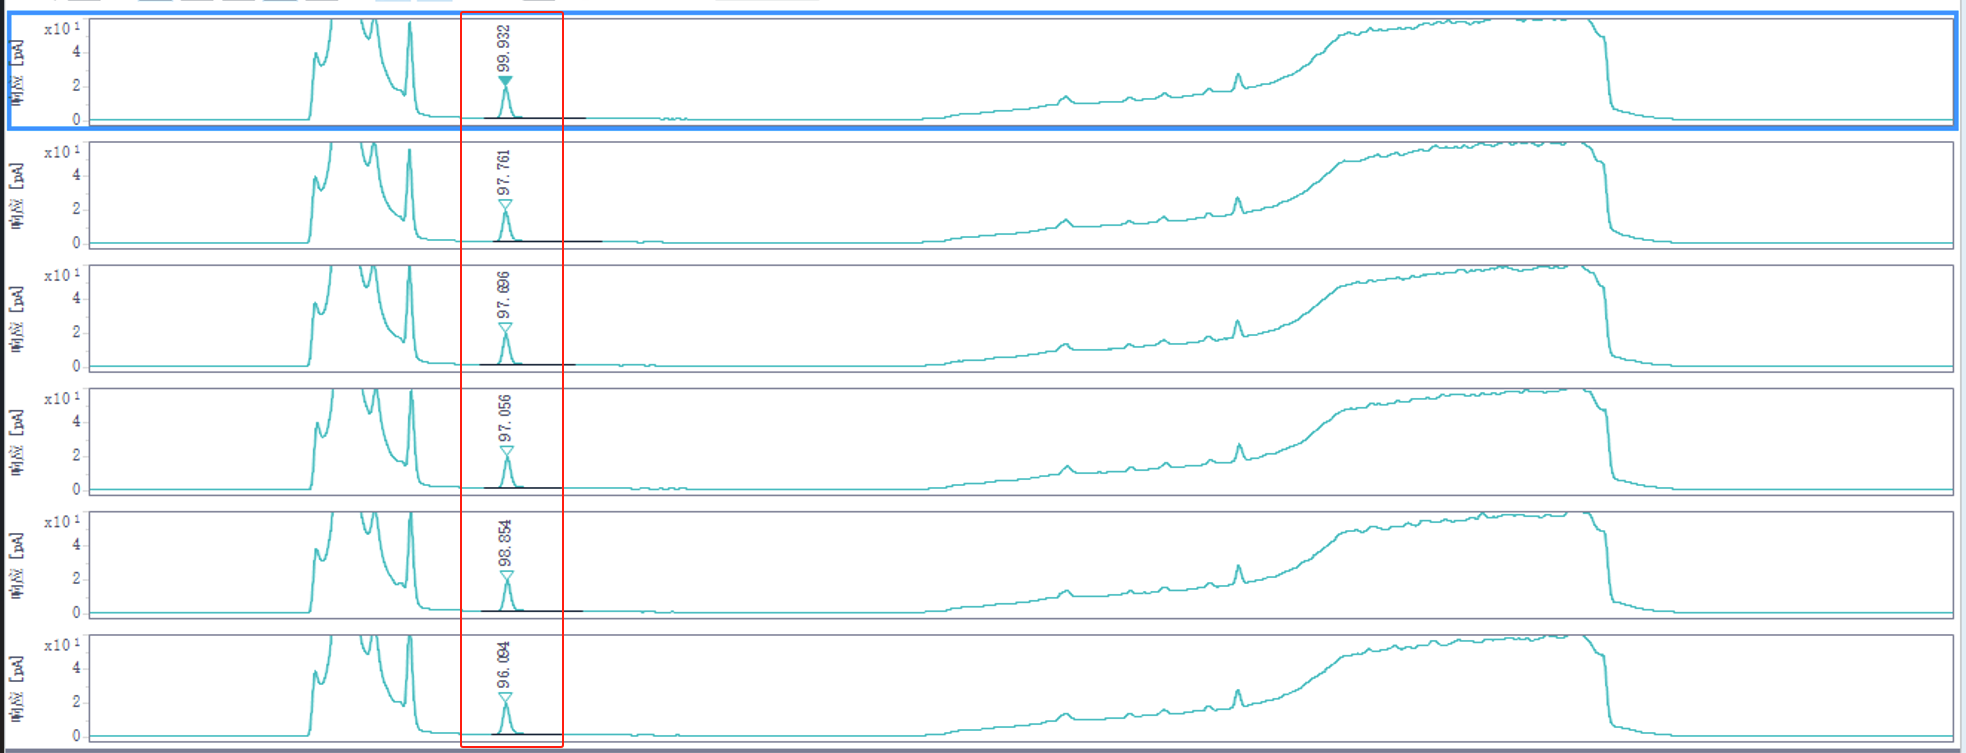
picture 3 STD Standard sample chart-repeatability chart
Injection serial number | retention time | Peak area | Peak height |
1 | 4.470 | 99.932 | 17.66 |
2 | 4.470 | 97.761 | 17.39 |
3 | 4.472 | 97.696 | 17.33 |
4 | 4.487 | 97.056 | 16.94 |
5 | 4.487 | 98.854 | 16.91 |
6 | 4.473 | 96.094 | 17.21 |
RSD% | 0.184 | 1.38 | 1.65 |
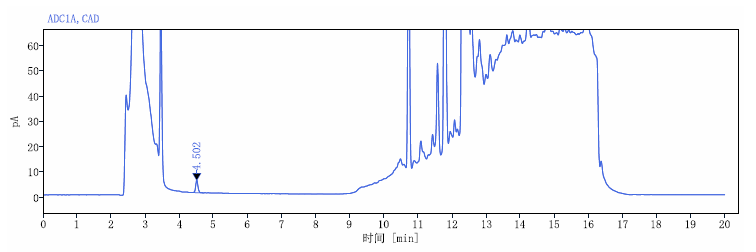
Sample injection 10μL, target peak piperidine The detection was good, and the peak area was 23.542, use the concentration linear standard curve to calculate its content, which is 2.9890µg/mL. Other peaks in the sample have higher responses, as shown in the following spectrum:
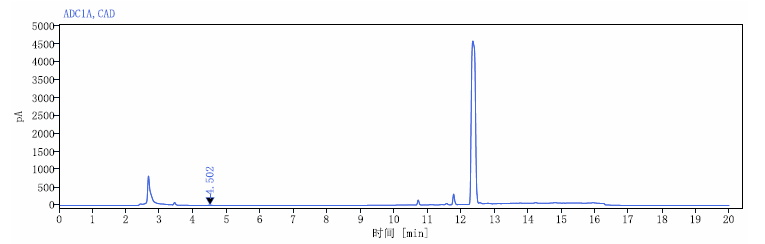
picture 4 sample diagram - full scale
 Instrumax (Tianjin) Co., Ltd.
picture 4 sample picture-enlarged picture