to hydrocortisone For example -Instrumax CAD Performance inspection




 Instrumax (Tianjin) Co., Ltd.Instrumax (Tianjin) Co., Ltd.
INSTRUMAX Nitrogen Generator g15)
Agilent liquid chromatograph(HPLC-1200)
Pipette (Finnpipette F1 20-200μL)
Mobile phase: acetonitrile: water =35:65
Column: InfinityLab Poroshell 120 EC-C18 3.0*100mm 2.7μm
Column temperature:35℃
Flow rate:0.4mL/min
Diluent: acetonitrile: water =50:50
Drift tube temperature:40℃ Atomized air flow:3L/min
Charging airflow:1L/min Charging current:1μA
Gain:0.05 RF:2.0
hydrocortisone(5mL:25mg) mother liquor concentration is 5mg/mL, gradually dilute with diluent to obtain 3mg/mL,2mg/mL,1mg/mL,500μg/mL,400μg/mL,300μg/mL,200μg/mL,100μg/mL,1μg/mL,0.01μg/mL equal concentration.
Instrumax (Tianjin) Co., Ltd.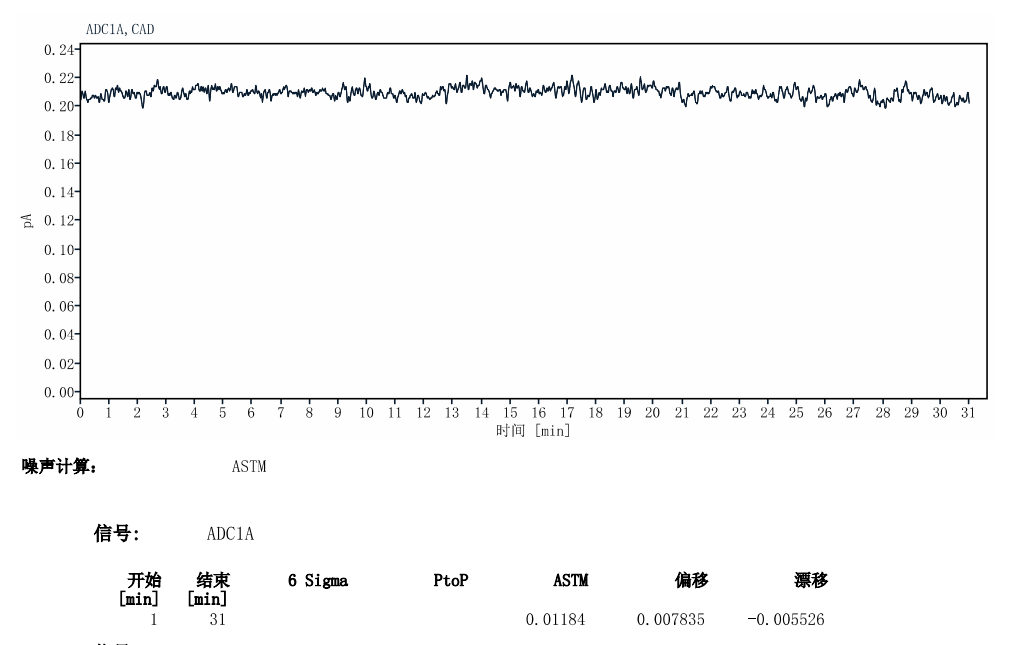
Noise /noise (ASTM) | Drift/drift | |
Test results | 11.84fA | 5.526fA |
Instrumax (Tianjin) Co., Ltd.Sample:0.01μg/mL hydrocortisone, injection 10μL
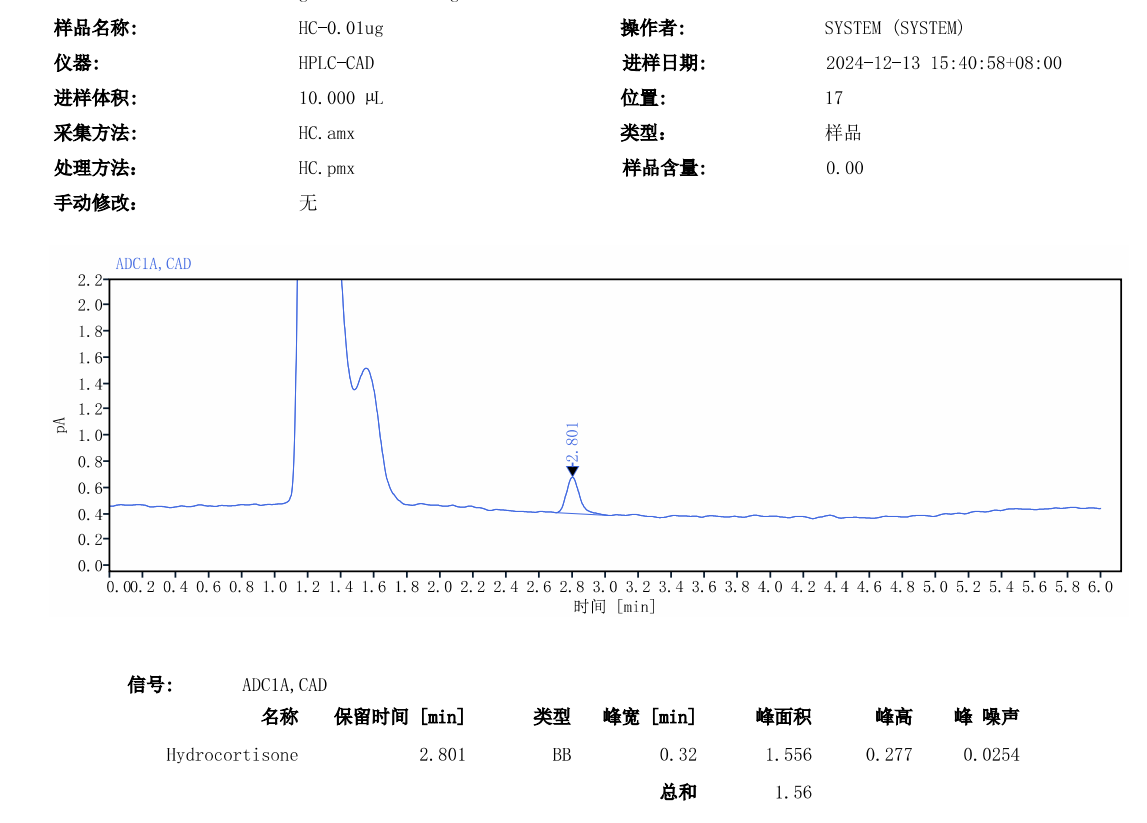
Refer to the following calculation formula to calculate the minimum detection concentration:
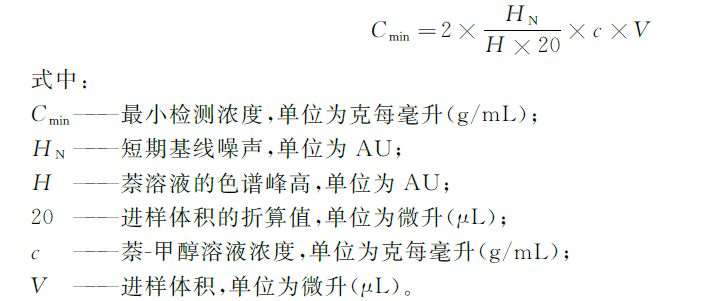
Minimum detection concentration (g/mL) | |
Test results | 9.17×10⁻¹⁰ |
Instrumax (Tianjin) Co., Ltd.Sample:100μg/mL,200μg/mL,300μg/mL,400μg/mL,500μg/mL;
1mg/mL,2mg/mL,3mg/mL, 5mg/mL
Test procedure:
in turn 100μg/mL,200μg/mL,300μg/mL,400μg/mL,500μg/mL Sample injection liquid chromatograph, make a standard curve based on concentration and corresponding response.
find on the curve hydrocortisone The concentration is greater than 500μg/mL The reading at each point is compared with the measured value at each corresponding concentration point. The magnitude difference is 5%The concentration when is used as the upper limit of detection CH, according to the obtained minimum detection concentration, it is the detection lower limit CLValue, CH/CLRatios are in the linear range.
Concentration (g/mL) | Peak height (pA) |
1.00E-04 | 405.449 |
2.00E-04 | 775.2993 |
3.00E-04 | 1097.881 |
4.00E-04 | 1474.238 |
5.00E-04 | 1796.026 |
Calculate the measured sample concentration according to the standard curve
Peak height (pA) | Measured concentration (g/mL) | Theoretical concentration*0.95 | Theoretical concentration*1.05 | Theoretical concentration (g/mL) |
3460.858 | 9.76E-04 | 9.50E-04 | 1.05E-03 | 1.00E-03 |
6736.961 | 1.92E-03 | 1.90E-03 | 2.10E-03 | 2.00E-03 |
8755.447 | 2.50E-03 | 2.85E-03 | 3.15E-03 | 3.00E-03 |
10979.724 | 3.14E-03 | 4.75E-03 | 5.25E-03 | 5.00E-03 |
Instrumax (Tianjin) Co., Ltd.From this we can get CHfor 2.00×10⁻³ g/mL,CLfor 9.17×10⁻¹⁰g/mL, linear range=CH/CL
linear range | |
Test results | 2.18×10⁶ |
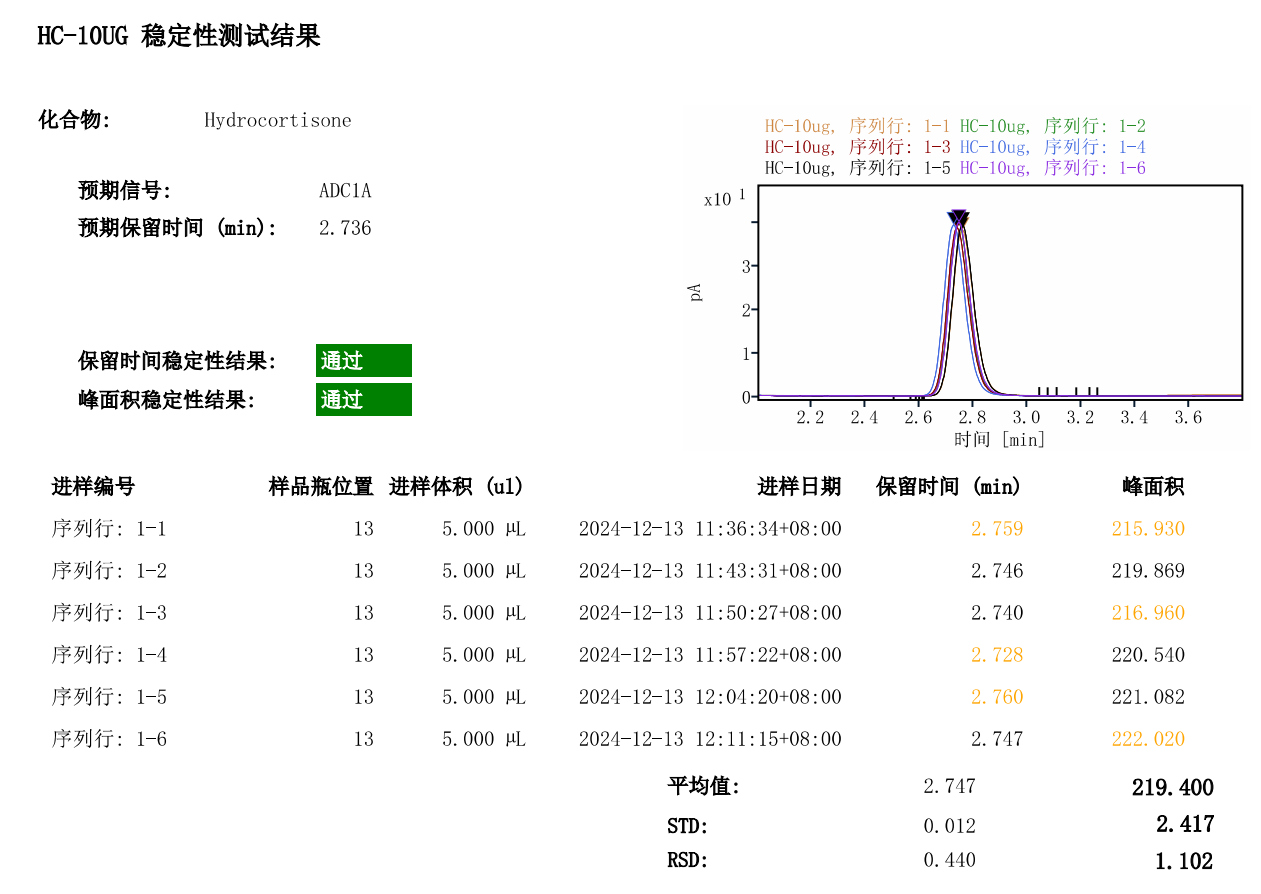
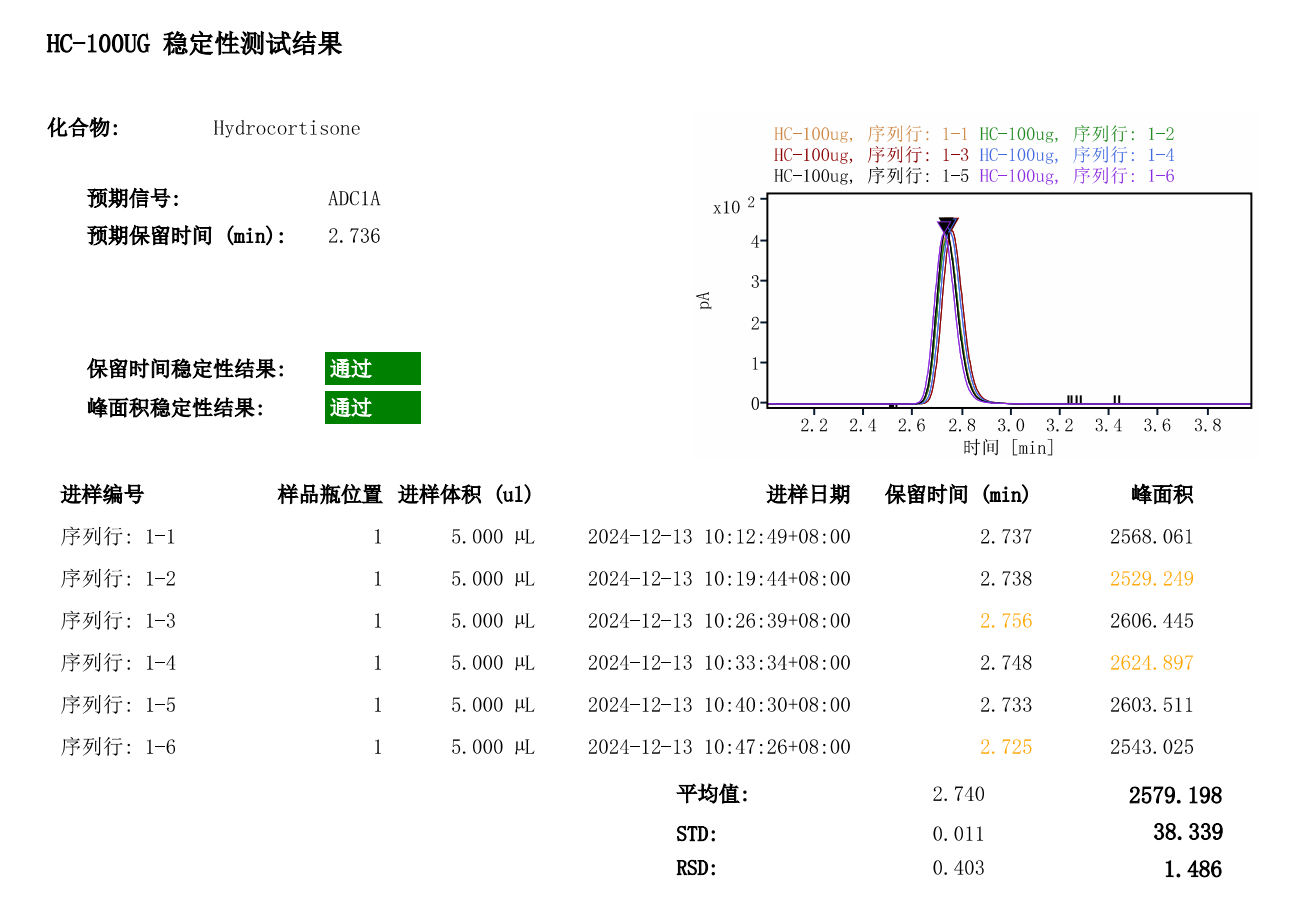
Sample:10μg/mL,100μg/mL hydrocortisone Sample, each injection 5μL
Test procedure: After the baseline is stable, inject a certain volume into the system to obtain glucose Standard solution, continuous measurement 6 times, record the retention time and peak area of the chromatogram, and calculate the relative standard deviation RSD6。
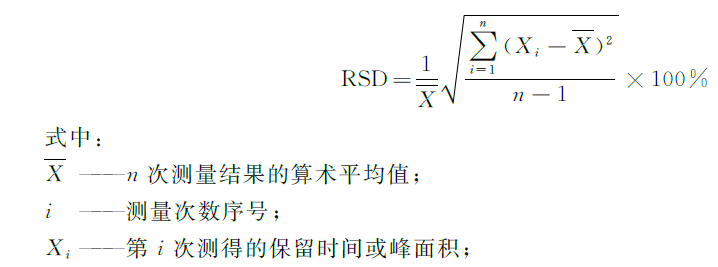
Test results:
Volume | 10μg | 10 µL | ||
retention time | Peak area | retention time | Peak area | |
RSD% | 0.440% | 1.102% | 0.403% | 1.486% |
 Instrumax (Tianjin) Co., Ltd.
Project | result | Suggested reference requirements |
baseline noise | 11.84fA | ≤40fA |
Baseline drift | 5.526fA | ≤40fA/20min |
Minimum detection concentration | 9.17×10⁻¹⁰ | ≤5×10⁻⁶g/mL hydrocortisone |
linear range | 2.18×10⁶ | better than 103 |
Qualitative repeatability | 0.403%(100μg/mL) | ≤1.5% |
Quantitative Repeatability | 1.486%(100μg/mL) | ≤4.0% |
Discussion of results:It can be seen from the noise drift, minimum detection concentration, linear range, repeatability and other results that Instrumax Charged Aerosol Detector (CAD) High sensitivity, wide linear range, good repeatability and good overall performance.
GB/T 26792-2019 liquid chromatograph
JJG 705-2014 high-performance liquid chromatograph