to caffeine For example -Instrumax CAD Performance inspection




 Instrumax (Tianjin) Co., Ltd.Instrumax (Tianjin) Co., Ltd.
Instruments: INSTRUMAX Charged Aerosol Detector (CAD)(CADetector a1)
INSTRUMAX Nitrogen Generator g15)
Agilent liquid chromatograph(HPLC-1200)
Column: InfinityLab Poroshell 120 EC-C18 3.0*100mm 2.7μm
Reagent: methanol (Merck HPLC grade) distilled water (Watson's)
Sample: water caffeine Solution standard material
(5μg/mL,25μg/mL,125μg/mL,250μg/mL,500μg/mL)




 (with certificate)
Mobile phase: methanol: water =20:80
Column: InfinityLab Poroshell 120 EC-C18 3.0×100mm 2.7μm
Column temperature:50℃
Flow rate:0.5mL/min
Instrumax (Tianjin) Co., Ltd.Drift tube temperature:35℃
Atomized air flow:3L/min
Charging airflow:1L/min
Charging current:1μA
Gain:0.05
RF:2.0
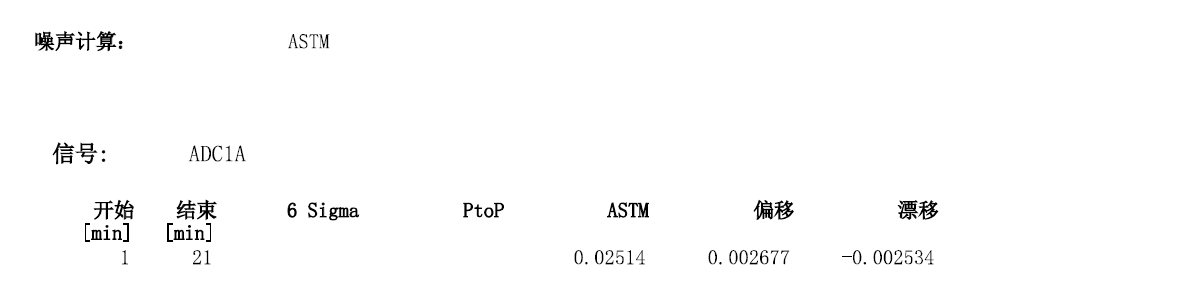
Noise Drift: Acquisition 21min, evaluation 1~21min noise drift
Signal to noise ratio:5μg/mL caffeine Standards, injection 10μL, evaluate the signal-to-noise ratio
Injection precision:25 µg/mL caffeine Standard solution (5 µL),5 µg/mL caffeine Standard solution (10µL),5 µg/mL caffeine Standard solution (20 µL), evaluate retention time, peak height RSD%
Response linearity: use include 5 traceable standards at different concentrations to confirm the linear response of the system. Calculate the correlation coefficient (r) between peak area and sample concentration, i.e. response linearity.
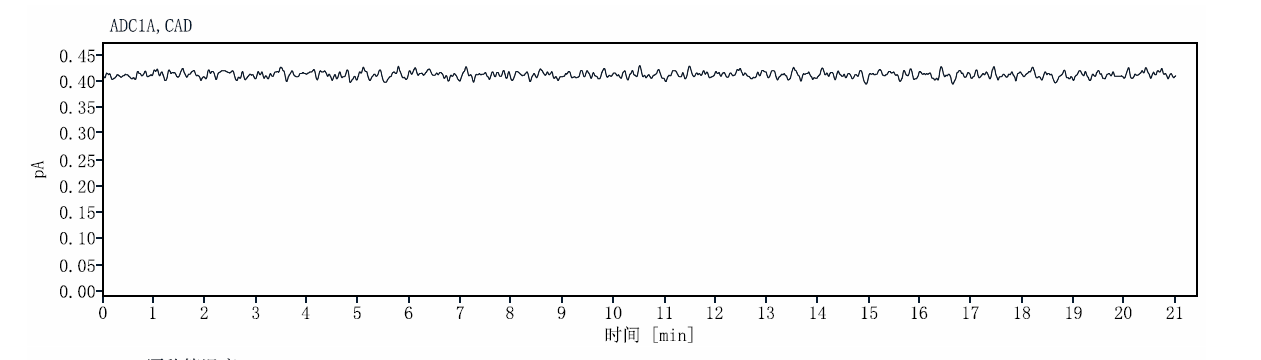 3.2.1 Baseline noise and baseline drift
noise (ASTM) | drift | |
Test results | 25.14fA | 2.534fA |
Instrumax (Tianjin) Co., Ltd.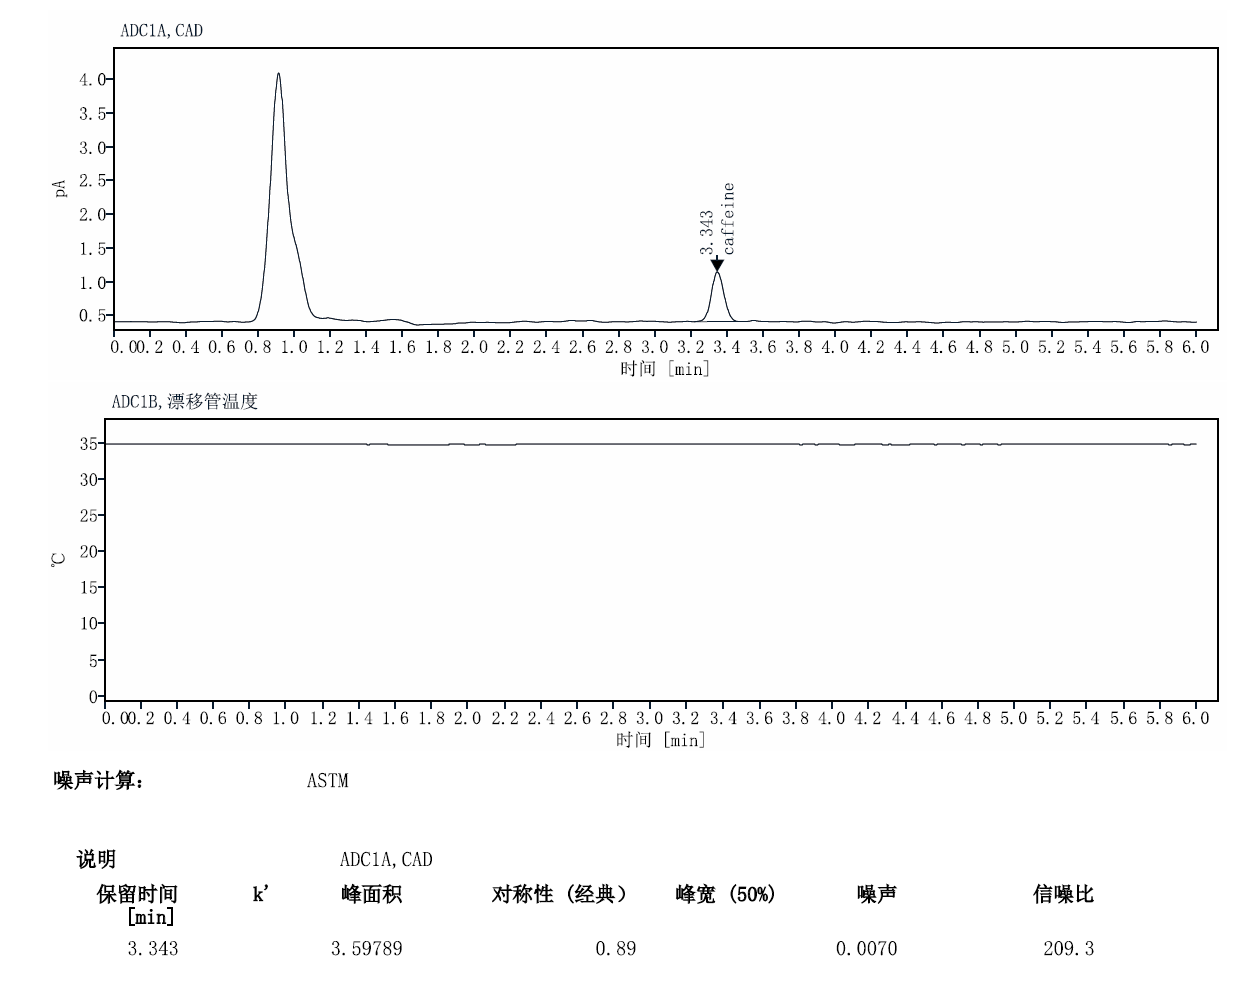 Sample:5.0μg/mL caffeine, injection 10μL
signal-to-noise ratio (50ng caffeine) | |
Test results | S/N=209.3 |
25 µg/mL caffeine Standard solution (5 µL),5 µg/mL caffeine Standard solution (10µL),5 µg/mL caffeine Standard solution (20 µL), evaluate retention time, peak height RSD%, the results are as follows:
5µg/mL caffeine Standard solution (10µL) | 5µg/mL caffeine Standard solution (20 µL) | 25µg/mL caffeine Standard solution (5 µL) | ||||||||
serial number | retention time | Peak height | serial number | retention time | Peak height | serial number | retention time | Peak height | ||
1 | 3.338 | 0.732 | 1 | 3.375 | 2.552 | 1 | 3.325 | 3.650 | ||
2 | 3.355 | 0.747 | 2 | 3.37 | 2.562 | 2 | 3.332 | 3.569 | ||
3 | 3.344 | 0.732 | 3 | 3.375 | 2.503 | 3 | 3.334 | 3.608 | ||
4 | 3.357 | 0.749 | 4 | 3.361 | 2.508 | 4 | 3.329 | 3.635 | ||
5 | 3.339 | 0.748 | 5 | 3.362 | 2.483 | 5 | 3.326 | 3.692 | ||
6 | 3.342 | 0.735 | 6 | 3.376 | 2.525 | 6 | 3.331 | 3.619 | ||
RSD% | 0.245 | 1.123 | RSD% | 0.202 | 1.201 | RSD% | 0.105 | 1.142 | ||
Instrumax (Tianjin) Co., Ltd.Use include 5 traceable standards at different concentrations to confirm the linear response of the system. Calculate the correlation coefficient (R) between peak area and sample concentration, that is, response linearity.
Concentration (μg/mL) | Peak area |
5 | 3.638 |
25 | 43.116 |
125 | 258.658 |
250 | 525.608 |
500 | 997.079 |
Response linearity | |
Test results | R2=0.9989 R=0.9995 |
Project | result | Suggested reference requirements |
baseline noise | 25.14fA | ≤40fA |
Baseline drift | 2.534fA | ≤40fA/20min |
signal-to-noise ratio | S/N=209.3 | ≥10 |
Precision | 1.142%(5μL) 1.123%(10μL) 1.201%(20μL) | ≤5.0% |
Response linearity | R=0.9995 | ≥0.991 |
Discussion of results:It can be seen from the results of noise drift, signal-to-noise ratio, precision, response linearity, etc.,Instrumax Charged Aerosol Detector (CAD) It has small noise drift, high sensitivity, good precision and good linearity. It is a powerful tool for detecting semi-volatile and non-volatile substances.